Hebelytics connects your marketing tools in one place and walks your funnel backwards with an AI until the sticking point is clear. For coaches and course creators running more than one tool.
Oder trag deine E-Mail ein, wir schicken dir den Zugang zum Demo-Video:
View with sample data from the demo account.
What this is about
Your ad account knows the clicks. Your email tool knows the opens. Your payment provider knows the purchases. Every tool is right, and none of them answers the question you actually care about: where are you losing people?
Before · your Monday morning
After · with Hebelytics
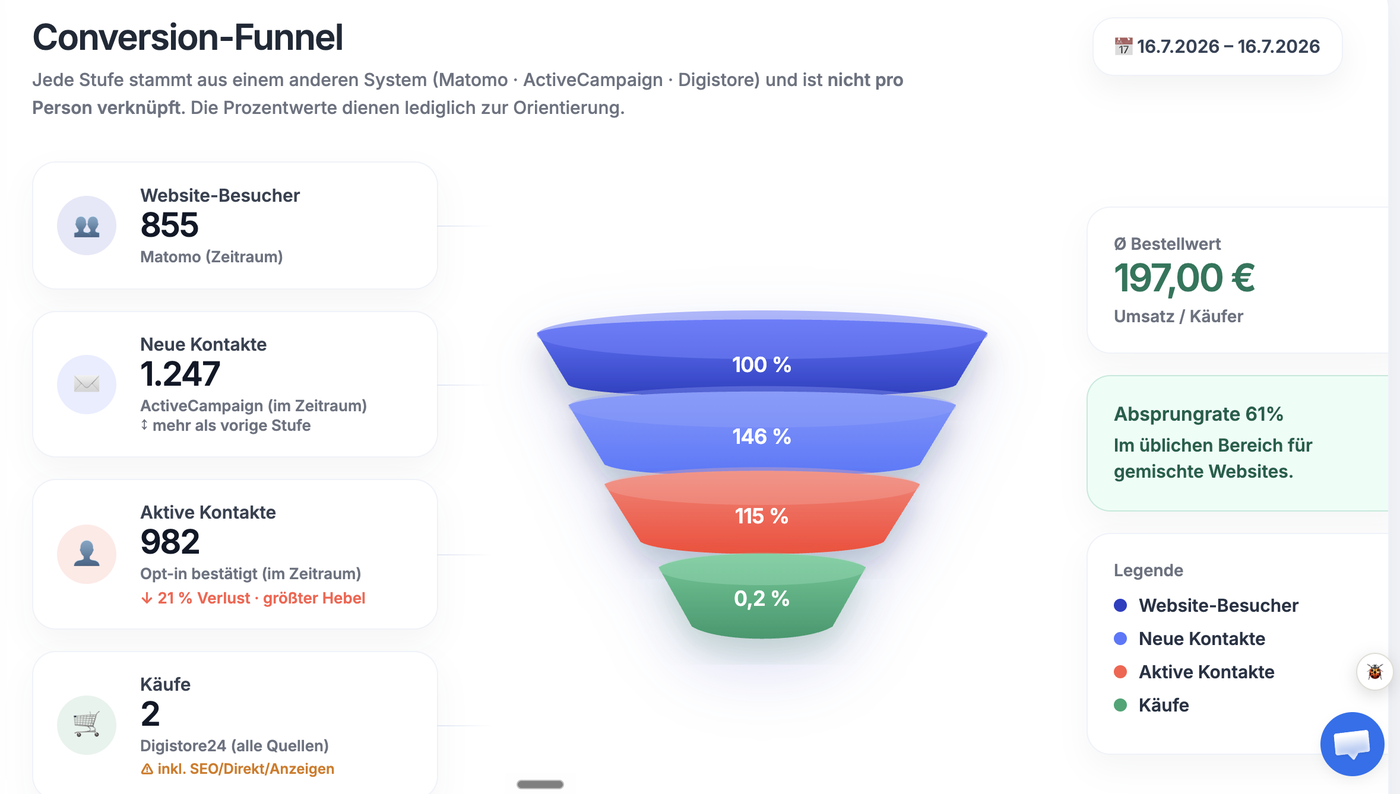
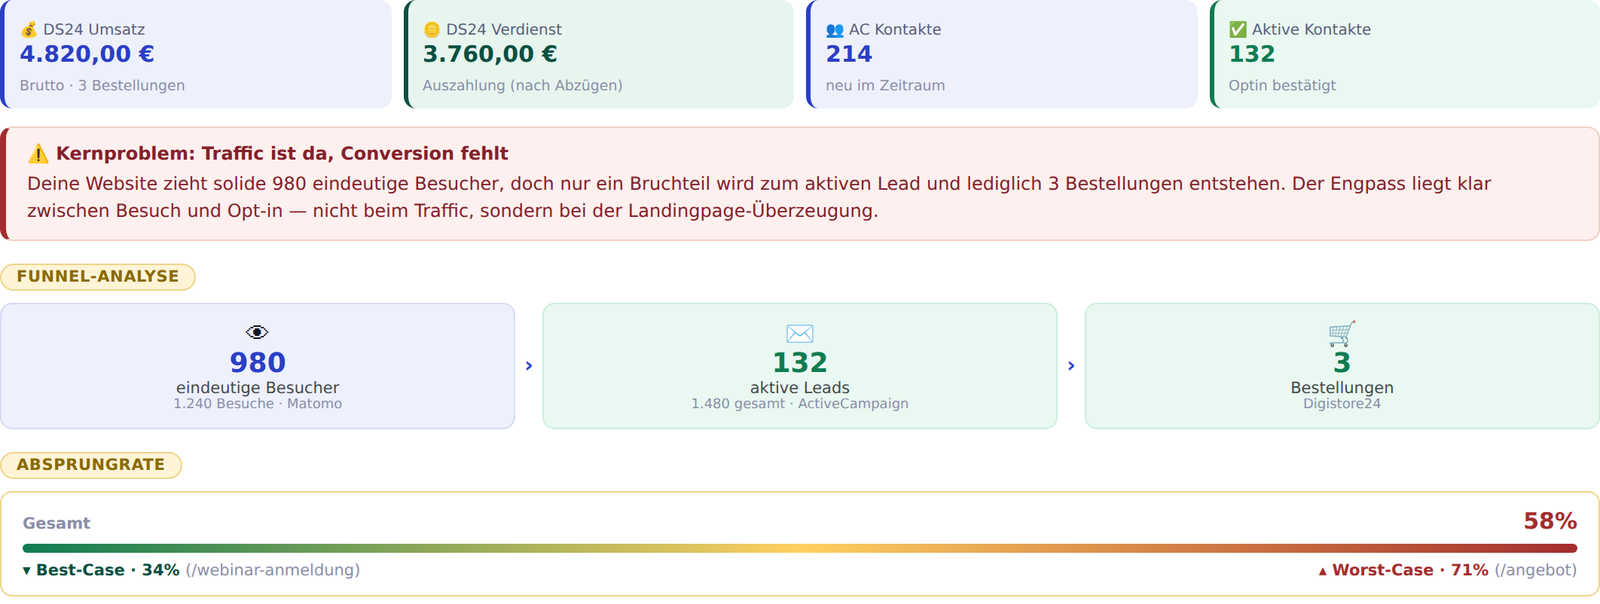
The figures come straight from your tools, over the same time range, in the same view. And instead of searching yourself, you ask the AI assistant which step in the funnel is the weakest.
What you get
Not a kit you have to assemble first. You connect your tools, the rest is already there.
Add your API key, stored encrypted. Hebelytics fetches the numbers itself, no export, no spreadsheet in between.
Every figure from your connected tools on one screen, over the time range you choose. Contacts, rates, revenue, visits, ad spend.
You ask in your own words and the answer is about your own numbers. No generic marketing tips, your figures.
Link a product to its list, its campaign and its landing page. Only then does the chain from ad to purchase become readable as a whole.
Revenue down? The analysis works backwards through the funnel, across every connected tool, until the step where it tips is clear.
What comes out is not a wall of numbers but a recommendation on where to start and what to measure to see whether it worked.
The AI system
The difference to an AI chat in your browser: the assistant in Hebelytics sees the data from your connected tools. It does not have to guess what is going on with you, and you do not have to type anything in.
Most people start at traffic and push more budget into the top. The assistant walks the chain the other way: from revenue to orders, from there to leads, to visits and finally to the source. It stops where the transition from one step to the next falls out of line.
You do not have to build a report or know a formula. You ask what is on your mind and get an answer based on your numbers. If the data is not solid enough for a reliable statement, the assistant says so instead of inventing one.
A walkthrough of the dashboard, recorded in the running product.
The tools
Hebelytics does not replace your tools, it reads them. So you keep everything you work with today and get the view across all of them on top.
Contacts, open and click rates, campaigns
Revenue, orders, products
Visits, bounce rate, paths through the site
Spend, conversions, campaigns
The list keeps growing. If your tool is missing, drop us a line at info@hebelytics.de and tell us which one you need.
The benefit
Every one of your tools already has its own reporting. It is just blind to everything happening outside it. And that is usually where the cause sits.
Your email tool cannot see ad spend, your ad account cannot see purchases. Side by side, what looks unremarkable on its own becomes visible.
One click sets the time range for every tool at once. No more comparing a 7-day figure with a 30-day one and learning nothing.
The figures arrive over an interface, not by copy and paste. That removes the weekly spreadsheet, and the typos in it.
A chart shows you that something dropped. The analysis tells you why, and what you would do next.
API keys are stored encrypted and used only to fetch your own numbers. Details in the privacy policy.
With one connected tool you get an overview. From the second one on, cross-tool analysis becomes possible, and every further tool makes the chain more complete.
The walkthrough shows you the dashboard as it really looks. After that you will know whether Hebelytics fits your setup.
Watch the demo